Foundation Overview
The Nash Community College Foundation, Inc. was established in 1983 to increase community awareness, raise funds for the student scholarship program, and help meet the needs of Nash Community College. These resources ensure that deserving students have the financial capability to take advantage of the quality instruction and higher educational opportunities the College provides.
Though the College’s tuition is considered to be reasonable, scholarships are critical to helping many students who wish to attend college but have very limited resources. Nash Community College receives hundreds of scholarship applications each year but is able to assist only a limited number of students. As the cost of education continues to rise, more scholarships are needed to truly make the difference in helping students reach their personal and professional goals.
The Nash Community College Foundation, Inc. is a tax-exempt, nonprofit organization as described in section 501(c)(3) of the IRS Code for 1984 as amended. The Foundation’s tax identification number is 58-1587982. All or a portion of your gift may be tax deductible as allowed by current tax laws. As required by law, the Foundation maintains exclusive control over the contribution. If you have questions about your gift’s designation or would like to learn more about the services that Nash Community College and the NCC Foundation are committed to providing, please call (252) 451-8440.
Annual Events
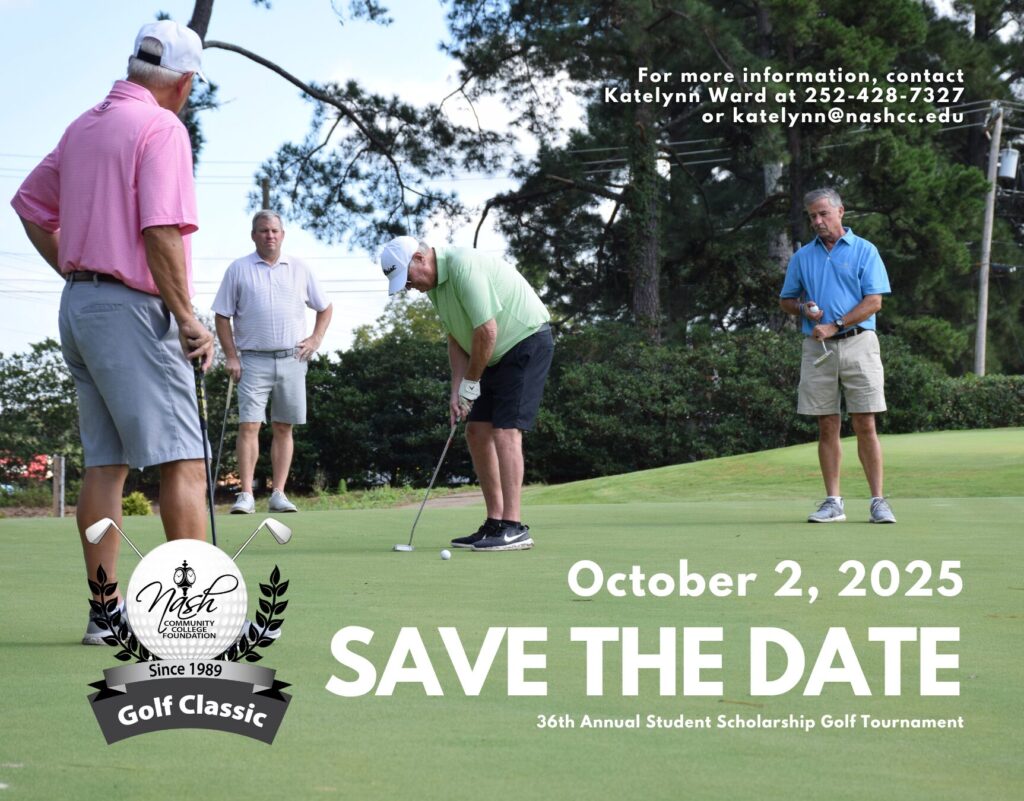
36th Annual Student Scholarship Golf Classic
October 2, 2025
Benvenue Country Club
Annual Student Scholarship Sporting Clays Tournament
Spring 2026
Rose Hill Farms Sporting Clays & Hunting Preserve
Annual Online Auction
Spring 2026
Register for the 2025 Golf Classic!
Leave a Legacy
Did you know that opportunities exist to form a lasting bond with Nash Community College? Your name and generosity will always be remembered when you make a planned gift that will last beyond your lifetime. In addition to the satisfaction that comes from investing in the future of our community through the advancement of education, you may realize significant tax and real estate planning benefits.
Bequests to the Nash Community College Foundation will reduce the size of your taxable estate while helping a worthy cause. A bequest may include specific property, a percentage of the estate, and/or the remainder of the estate after other bequests have been fulfilled.
Life Insurance Policies may be given outright, dividends may be assigned, or the NCC Foundation may be listed as a beneficiary of the policy.
Securities and Real Estate – Gifts of appreciated securities, stock, or real estate can be a very advantageous way of giving to the NCC Foundation. If you have owned the stock or property for more than one year, you may deduct the fair market value and avoid all capital gain taxes.
For information on making stock transfers directly into the NCC Foundation account, please contact (252) 451-8440.
NCC Foundation Mailing Address:
P.O. Box 7488, Rocky Mount, NC 27804

Sign up for alumni communications, view alumni news or share your success stories with us.
The Nash Community College Alumni Association exists to create a spirit of loyalty between alumni and the College and encourage alumni activity, interaction, engagement and support. NCC Alumni Association membership is open to all who attended Nash Community College. All Alumni Association members receive all membership privileges and benefits. Student memberships are also available.
If you wish to receive alumni communications or would like to update your contact information and profile, call us at the number below. We would love to hear about your successes.
The Nash Community College Outstanding Alumnus Award annually honors a graduate or student who is making outstanding contributions in their chosen profession and service to their community.
The Chair of the Board of Trustees or designee, the College President, Executive Vice President, Vice Presidents, and Foundation Executive Director will review all nominations and submit a recommendation to the NCC Board of Trustees for their approval at the March meeting.
Eligibility
- Nash Community College graduate or student who has provided outstanding service to the college
- Has achieved recognition in his or her profession
- Makes significant contributions to his or her community through public service and civic involvement
Please complete the Outstanding Alumnus Award Nomination Form.
Contact

Katelynn Ward
Assistant Director, NCC Foundation
Building: Business & Industry Center
Room: 1106
Phone: 252-428-7327
Give the Gift of Education
With only 35% of students eligible for federal aid, that leaves a significant number of the over 3,000 students that Nash Community College serves each semester with little or no financial assistance. Please give to help provide a better future for NCC students.
Upcoming Events
- 08/11/2025
-
-
Team Nash Workdays
-
NCC at NC Works
-
- 08/12/2025
-
-
Team Nash Workdays
-
Team Nash Professional Development Sessions
-
The NCC Newswire is the College’s one-stop source for official NCC news.
Have a story idea? Email nccpr@nashcc.edu
- Nash Community College Annual Photo Contest Winnerson 01/28/2025
The annual Nash Community College Photo Contest, an initiative led by the President’s office under the direction of Dr. Lew K. Hunnicutt, successfully wrapped up with a record-breaking number of... […]
- Nash Community College Celebrates National Popcorn Day with President Hunnicutton 01/17/2025
In celebration of National Popcorn Day, Nash Community College President, Dr. Lew Hunnicutt and the President’s Office hosted a fun and festive event for students and staff today. While National... […]
- Keel Named as Academic Excellence Award Recipienton 01/08/2025
Nash Community College is proud to announce that Tammy Keel, a dedicated full-time student in the Emergency Management Program, has been selected as the recipient of the school’s prestigious […]
- Governor Cooper Delivers Farewell Address at Nash Community Collegeon 12/18/2024
Governor Roy Cooper visited Nash Community College today to deliver his official farewell address as he concludes his second term in office. The event, attended by invited guests, community […]
- Spring Registration in Full Swing at Nash Community Collegeon 12/10/2024
Spring registration is open at Nash Community College for the 2025 semester, offering flexible course options and a variety of programs designed to help students advance their careers or complete... […]
- Nash Community College Hosts Legislative Luncheonon 12/05/2024
Last month, Nash Community College (NCC) hosted its annual Legislative Luncheon, where local, state and national government representatives gathered for an insightful presentation by NCC President […]
- Nash Community College Students Named 2025 UNC Health Nash Scholarson 11/26/2024
Nash Community College is proud to announce the selection of 11 students to the prestigious 2025 UNC Health Nash Nurse Scholars Program. This year’s cohort of 29 students marks the... Continue […]
The Office of Institutional Effectiveness serves the college in the collection, analysis, and publication of data to support informed decision-making based on institutional outcomes. In compliance with Southern Association of Colleges and Schools Commission on Colleges (SACSCOC) requirements, student achievement data is published including data on student completion and North Carolina Community College System (NCCCS) Performance Measures.
Other institutional data, including enrollment and full-time enrollment (FTE), is also provided below. Requests for data and/or permission to conduct research on campus will be considered by the Office of Institutional Effectiveness.
For employees, planning resources are available to assist in the annual collection and analysis of unit-level outcomes. Training for groups or individuals is always available upon request.
Student Achievement Data
Strategic Planning
Other Documents
Student Achievement Data
Seven student achievement/success measures are used by all 58 community colleges within the North Carolina Community College System (NCCCS). These measures are called the NCCCS Performance Measures of Student Success and are commonly referred to as the Performance Measures. Each Performance Measure has goals that include a baseline as the minimum threshold level as well as an
excellence level. These levels have historically remained the same for three years and then reset based on system performance. Beginning with the report released in 2022, all metrics shifted to an index score, and the baseline and excellence levels are set to change annually. Although this was the first year of reporting index scores, the NCCCS provided historical data as well for colleges
for trend analysis. The baseline and excellence levels, however, were not recalculated for past years and therefore are represented here as static levels over the time periods represented.
Basic Skills Student Progress
| 19-20 | 20-21 | 21-22 | 22-23 | |
|---|---|---|---|---|
| NCC Basic Skills Progress | 1.166 | 0.949 | 1.053 | 1.278 |
| Baseline | 0.283 | 0.283 | 0.527 | 0.543 |
| Excellence Level | 1.348 | 1.348 | 1.241 | 1.216 |
Purpose: To ensure individuals with low literacy skills are progressing academically toward credential or employment.
Description: Index score based on the percentage of Basic Skills periods of participation (POP) with a measurable skill gain (MSG).
Calculation:
Success Rate
Denominator: Number of Periods of Participation (POP) during the Basic Skills program year (July 1 to June 30). A POP begins each time a student enrolls in adult education, accumulates at least 12 contact hours, and then exits the program. Subsequent periods occur when a student re-enters the program after 90 days have lapsed since the person last received services and accumulates 12 or more contact hours. If there is no exit, the POP continues to the next program year.
Numerator: Based on the denominator, number of periods of participation in which at least one measurable skill gain was achieved. Participants can demonstrate MSG in in six ways:
- Pre and Post testing: The student scores high enough on an NRS approved posttest to place into a higher educational functioning level than indicated by the student’s pretest.
- Adult High School Credits: The student enters an Adult High School (AHS) program with less than 75% of the required AHS credits and obtained enough AHS credits to exceed the 75% threshold prior to the end of the program year (June 30)
- Post-Secondary Enrollment: The student exits the program and subsequently enrolls in post-secondary education prior to the end of the program year (June 30). Post-secondary enrollment is verified by data matching to the National Student Clearinghouse and the NCCCS Data Warehouse.
- High School Equivalency Test Graduate: The student achieves a passing score on State-approved high school equivalency tests (GED, HiSet, or TASC) prior to the end of the program year (June 30). Credit is given based on matching student records to a passers database populated by the test vendors. Matching occurs based on an exact match of first name, last name and date of birth and/or the HSEID.
- Adult High School Graduate: The student completes the requirements of the Adult High School program and is issued an adult high school diploma prior to the end of the program year (June 30).
- Integrated Education and Training (IET): Applicable to participants in IET or workplace literacy programs only; includes exhibiting progress on a secondary or post-secondary transcript, showing progress toward milestones, or passing a technical/occupational knowledge-based exam.
Index Score: College success rate divided by the systemwide success rate.
Data Sources:
- Benchmark Advansys
- Comprehensive Curriculum Student Report
- Continuing Education Registration Report
- Diploma Sender
- National Student Clearinghouse
Student Success Rate in College-Level English Courses
| 2017 cohort | 2018 cohort | 2019 cohort | 2020 cohort | |
|---|---|---|---|---|
| NCC Credit English Success | 0.841 | 0.777 | 0.855 | 0.788 |
| Baseline | 0.747 | 0.747 | 0.723 | 0.727 |
| Excellence Level | 1.147 | 1.147 | 1.144 | 1.174 |
Purpose: To ensure students are successfully completing a credit-bearing English course within their first three academic years.
Description: Index score based on the percentage of first-time fall associate degree seeking and transfer pathway students passing a credit-bearing English course with a “C” or better within three years.
Calculation:
Success Rate
Denominator: First-time fall associate degree and transfer pathway students (i.e., students with a curriculum code that begins with an A or P) during their first fall.
Numerator: Of those in the denominator, the number earning a standard letter grade of A, B, C, or P in at least one credit-bearing (course number >=100) English course within three years (by the end of the third summer term).
Index Score
Pell and Underserved Race/Ethnicity (URE) Index Score: College success rate among cohort students receiving Pell whose race/ethnicity is identified as historically underserved divided by the statewide success rate among cohort students receiving Pell whose race/ethnicity is identified as historically underserved.
Pell and Non-Underserved Race/Ethnicity (Non-URE) Index Score: College success rate among cohort students receiving Pell whose race/ethnicity is not identified as historically underserved divided by the statewide success rate among cohort students receiving Pell whose race/ethnicity is not identified as historically underserved.
Non-Pell and Underserved Race/Ethnicity (URE) Index Score: College success rate among cohort students not receiving Pell whose race/ethnicity is identified as historically underserved divided by the statewide success rate among cohort students not receiving Pell whose race/ethnicity is identified as historically underserved.
Non-Pell and Non-Underserved Race/Ethnicity (Non-URE) Index Score: College success rate among cohort students not receiving Pell whose race/ethnicity is not identified as historically underserved divided by the statewide success rate among cohort students receiving not Pell whose race/ethnicity is not identified as historically underserved.
Pell and URE Denominator: Number of cohort students receiving Pell whose race/ethnicity is identified as historically underserved.
Pell and Non-URE Denominator: Number of cohort students receiving Pell whose race/ethnicity is not identified as historically underserved.
Non-Pell and URE Index Denominator: Number of cohort students not receiving Pell whose race/ethnicity is identified as historically underserved.
Non-Pell and Non-URE Index Denominator: Number of cohort students not receiving Pell whose race/ethnicity is not identified as historically underserved.
Total Numerator: (Pell and URE Index Score × Pell and URE Denominator) + (Pell and Non-URE Index Score × Pell and Non-URE Denominator) + (Non-Pell and URE Index Score × Non-Pell and Non-URE Denominator) + (Non-Pell and Non-URE Index Score × Non-Pell and Non-URE Denominator)
Total Denominator: Pell and URE Denominator + Pell and Non-URE Denominator + Non-Pell and URE Denominator + Non-Pell and Non-URE Denominator
Total Index Score: Total Numerator divided by Total Denominator
Data Sources
- Comprehensive Curriculum Student Report
- National Student Clearinghouse
Additional Details
Pell category based on Pell status during a student’s first fall semester.
Underserved minority race/ethnicities include American Indian, Black, Hawaiian/Pacific Islander, Hispanic, and Multiple Races.
Student Success Rate in College-Level Math Courses
| 2017 cohort | 2018 cohort | 2019 cohort | 2020 cohort | |
|---|---|---|---|---|
| NCC Credit Math Success | 1.144 | 1.153 | 1.274 | 1.063 |
| Baseline | 0.662 | 0.662 | 0.626 | 0.665 |
| Excellence Level | 1.192 | 1.192 | 1.194 | 1.204 |
Purpose: To ensure students are successfully completing credit-bearing Math courses within their first three academic years.
Description: Index score based on the percentage of first-time fall associate degree seeking and transfer pathway students passing a credit-bearing Math course with a “C” or better within three years.
Calculation:
Success Rate
Denominator: First-time fall associate degree and transfer pathway students (i.e., students with a curriculum code that begins with an A or P) during their first fall.
Numerator: Of those in the denominator, the number earning a standard letter grade of A, B, C, or P in at least one credit-bearing (course number >=100) Math course within three years (by the end of the third summer term).
Index Score
Pell and Underserved Race/Ethnicity (URE) Index Score: College success rate among cohort students receiving Pell whose race/ethnicity is identified as historically underserved divided by the statewide success rate among cohort students receiving Pell whose race/ethnicity is identified as historically underserved.
Pell and Non-Underserved Race/Ethnicity (Non-URE) Index Score: College success rate among cohort students receiving Pell whose race/ethnicity is not identified as historically underserved divided by the statewide success rate among cohort students receiving Pell whose race/ethnicity is not
identified as historically underserved.
Non-Pell and Underserved Race/Ethnicity (URE) Index Score: College success rate among cohort students not receiving Pell whose race/ethnicity is identified as historically underserved divided by the statewide success rate among cohort students not receiving Pell whose race/ethnicity is
identified as historically underserved.
Non-Pell and Non-Underserved Race/Ethnicity (Non-URE) Index Score: College success rate among cohort students not receiving Pell whose race/ethnicity is not identified as historically underserved divided by the statewide success rate among cohort students receiving not Pell whose race/ethnicity is not identified as historically underserved.
Pell and URE Denominator: Number of cohort students receiving Pell whose race/ethnicity is identified as historically underserved.
Pell and Non-URE Denominator: Number of cohort students receiving Pell whose race/ethnicity is not identified as historically underserved.
Non-Pell and URE Index Denominator: Number of cohort students not receiving Pell whose race/ethnicity is identified as historically underserved.
Non-Pell and Non-URE Index Denominator: Number of cohort students not receiving Pell whose race/ethnicity is not identified as historically underserved.
Total Numerator: (Pell and URE Index Score × Pell and URE Denominator) + (Pell and Non-URE Index Score × Pell and Non-URE Denominator) + (Non-Pell and URE Index Score × Non-Pell and Non-URE Denominator) + (Non-Pell and Non-URE Index Score × Non-Pell and Non-URE Denominator)
Total Denominator: Pell and URE Denominator + Pell and Non-URE Denominator + Non-Pell and URE Denominator + Non-Pell and Non-URE Denominator
Total Index Score: Total Numerator divided by Total Denominator
Data Sources
- Comprehensive Curriculum Student Report
- National Student Clearinghouse
Additional Details
Pell category based on Pell status during a student’s first fall semester.
Underserved minority race/ethnicities include American Indian, Black, Hawaiian/Pacific Islander, Hispanic, and Multiple Races.
First Year Progression
| 2019 | 2020 | 2021 | 2022 | |
|---|---|---|---|---|
| NCC First Year Progression | 0.979 | 1.000 | 1.002 | 1.001 |
| Baseline | 0.872 | 0.872 | 0.874 | 0.899 |
| Excellence Level | 1.069 | 1.069 | 1.067 | 1.063 |
Purpose: To ensure first-year students are making progress toward credential completion.
Description: Index score based on the percentage of first-time fall credential-seeking curriculum students graduated prior to or enrolled in postsecondary education the subsequent fall semester.
Calculation
Success Rate
Denominator: First-time fall credential-seeking curriculum students.
Numerator: Of those in the denominator, the number who graduate with a postsecondary credential prior to the subsequent fall term or return to post-secondary education during the subsequent fall term.
Index Score
Pell and Underserved Race/Ethnicity (URE) Index Score: College success rate among cohort students receiving Pell whose race/ethnicity is identified as historically underserved divided by the statewide success rate among cohort students receiving Pell whose race/ethnicity is identified as historically underserved.
Pell and Non-Underserved Race/Ethnicity (Non-URE) Index Score: College success rate among cohort students receiving Pell whose race/ethnicity is not identified as historically underserved divided by the statewide success rate among cohort students receiving Pell whose race/ethnicity is not identified as historically underserved.
Non-Pell and Underserved Race/Ethnicity (URE) Index Score: College success rate among cohort students not receiving Pell whose race/ethnicity is identified as historically underserved divided by the statewide success rate among cohort students not receiving Pell whose race/ethnicity is identified as historically underserved.
Non-Pell and Non-Underserved Race/Ethnicity (Non-URE) Index Score: College success rate among cohort students not receiving Pell whose race/ethnicity is not identified as historically underserved divided by the statewide success rate among cohort students receiving not Pell whose race/ethnicity is not identified as historically underserved.
Pell and URE Denominator: Number of cohort students receiving Pell whose race/ethnicity is identified as historically underserved.
Pell and Non-URE Denominator: Number of cohort students receiving Pell whose race/ethnicity is not identified as historically underserved.
Non-Pell and URE Index Denominator: Number of cohort students not receiving Pell whose race/ethnicity is identified as historically underserved.
Non-Pell and Non-URE Index Denominator: Number of cohort students not receiving Pell whose race/ethnicity is not identified as historically underserved.
Total Numerator: (Pell and URE Index Score × Pell and URE Denominator) + (Pell and Non-URE Index Score × Pell and Non-URE Denominator) + (Non-Pell and URE Index Score × Non-Pell and Non-URE Denominator) + (Non-Pell and Non-URE Index Score × Non-Pell and Non-URE Denominator)
Total Denominator: Pell and URE Denominator + Pell and Non-URE Denominator + Non-Pell and URE Denominator + Non-Pell and Non-URE Denominator
Total Index Score: Total Numerator divided by Total Denominator
Data Sources
- Comprehensive Curriculum Student Report
- Graduation Extract data file
- National Student Clearinghouse
Additional Details
Pell category based on Pell status during a student’s first fall semester.
Underserved minority race/ethnicities include American Indian, Black, Hawaiian/Pacific Islander, Hispanic, and Multiple Races.
Curriculum Student Completion
| 2016 cohort | 2017 cohort | 2018 cohort | 2019 cohort | |
|---|---|---|---|---|
| NCC Curriculum Completion Rate | 0.885 | 0.877 | 0.928 | 0.957 |
| Baseline | 0.853 | 0.853 | 0.850 | 0.817 |
| Excellence Level | 1.094 | 1.094 | 1.086 | 1.094 |
Purpose: To ensure student completion and/or persistence toward a post-secondary credential in a timely manner.
Description: Index score based on the percentage of first-time fall credential-seeking curriculum students who graduate, transfer, or are enrolled
during the fourth academic year with 42 successfully completed non-developmental hours.
Calculation:
Success Rate
Denominator: First-time fall credential-seeking curriculum students.
Numerator: Of those in the denominator, the number of students who have graduated, transferred, or are still enrolled during the fourth academic year (fall, spring, or summer) with at least 42 successfully completed non-developmental hours.
To be successful, students must complete one or more of the following:
- Graduation: Graduated from a North Carolina Community College credential program (A, D, or C) before the end of the 4th summer term following the first fall semester.
- Transfer: Transferred to a 4-year college as indicated in the National Student Clearinghouse database at any point through the end of the 4th summer term following the first fall semester.
- Persistence: Student is enrolled in an NCCCS college during the 4th academic year (fall, spring or summer) and has successfully completed at least 42 non-developmental credit hours by the end of the summer term. Successful completion is defined as achieving a course standard letter grade of A, B, C, or P.
Index Score
Pell and Underserved Race/Ethnicity (URE) Index Score: College success rate among cohort students receiving Pell whose race/ethnicity is identified as historically underserved divided by the statewide success rate among cohort students receiving Pell whose race/ethnicity is identified as historically underserved.
Pell and Non-Underserved Race/Ethnicity (Non-URE) Index Score: College success rate among cohort students receiving Pell whose race/ethnicity is not identified as historically underserved divided by the statewide success rate among cohort students receiving Pell whose race/ethnicity is not identified as historically underserved.
Non-Pell and Underserved Race/Ethnicity (URE) Index Score: College success rate among cohort students not receiving Pell whose race/ethnicity is identified as historically underserved divided by the statewide success rate among cohort students not receiving Pell whose race/ethnicity is identified as historically underserved.
Non-Pell and Non-Underserved Race/Ethnicity (Non-URE) Index Score: College success rate among cohort students not receiving Pell whose race/ethnicity is not identified as historically underserved divided by the statewide success rate among cohort students receiving not Pell whose race/ethnicity is not identified as historically underserved.
Pell and URE Denominator: Number of cohort students receiving Pell whose race/ethnicity is identified as historically underserved.
Pell and Non-URE Denominator: Number of cohort students receiving Pell whose race/ethnicity is not identified as historically underserved.
Non-Pell and URE Index Denominator: Number of cohort students not receiving Pell whose race/ethnicity is identified as historically underserved.
Non-Pell and Non-URE Index Denominator: Number of cohort students not receiving Pell whose race/ethnicity is not identified as historically underserved.
Total Numerator: (Pell and URE Index Score × Pell and URE Denominator) + (Pell and Non-URE Index Score × Pell and Non-URE Denominator) + (Non-Pell and URE Index Score × Non-Pell and Non-URE Denominator) + (Non-Pell and Non-URE Index Score × Non-Pell and Non-URE Denominator)
Total Denominator: Pell and URE Denominator + Pell and Non-URE Denominator + Non-Pell and URE Denominator + Non-Pell and Non-URE Denominator
Total Index Score: Total Numerator divided by Total Denominator
Data Sources
- Comprehensive Curriculum Student Report
- Graduation Extract data file
- National Student Clearinghouse
Additional Details
Pell category based on Pell status during a student’s first fall semester.
Underserved minority race/ethnicities include American Indian, Black, Hawaiian/Pacific Islander, Hispanic, and Multiple Races.
Licensure and Certification Passing Rate
| 19-20 | 20-21 | 21-22 | 22-23 | |
|---|---|---|---|---|
| NCC Licensure Passing Rates | 0.941 | 0.949 | 0.966 | 0.970 |
| Baseline | 0.750 | 0.800 | 0.806 | 0.811 |
| Excellence Level | 1.09 | 1.073 | 1.069 | 1.073 |
Purpose: To ensure programmatic coursework prepares students to competently practice in their chosen profession.
Description: Index score based on the percentage of first-time test-takers passing licensure and certification exams within each exam. Exams included in this measure are state mandated exams which candidates must pass before becoming active practitioners.
Calculation:
Success Rate
Denominator: All licensure and certification exams taken for the first-time during the licensure agency’s most recent reporting year. Only includes state mandated exams which candidates must pass before becoming active practitioners.
Numerator: Of those in the denominator, the number passing the exam on their first attempt during the licensure agency’s most recent reporting year.
Index Score
License Index Score (LIS): College license success rate divided by the statewide license success rate on same exam.
License Denominator (LD): Number of first-time test-takers within each exam.
Total Numerator: Sum of the product of each License Index Score and their License Denominator [(LIS1 × LD1) + (LIS2 × LD2) + …)]
Total Denominator: Sum of License Denominators across all exams (LD1 + LD2 + LD3 +…)
Total Index Score: Total Numerator divided by Total Denominator
Data Sources:
- Council of Interstate Testing: Dental Hygiene Exam
- NC Board of Occupational Therapy: Occupational Therapist Assistant
- NC Board of Nursing: Practical Nursing, Registered Nursing
- NC Board of Physical Therapy Examiners: Physical Therapist Assistant
- American Registry of Radiologic Technologists: Radiography
- NC Department of Insurance, Office of State Fire Marshal – Code Officials Qualification Board: Building Inspector, Electrical Inspector, Fire Inspector, Mechanical Inspector, Plumbing Inspector
- Federation of State Massage Therapy Boards: Massage & Body Work Therapist
- NC Veterinary Medical Board: Veterinary Medicine Technology
- NC Office of Emergency Medical Services: EMR, EMT, EMT-P, AEMT
- NC Department of Health and Human Services: Nurse Aide I
- NC Department of Justice, Criminal Justice Standards Division: Basic Law Enforcement Training
- NC Department of Justice, Sheriff’s Training & Standards Division: Detention Officer
- NC Board of Barber Examiners: Barber
- DL Roope Administrations Inc.: Apprentice, Cosmetology, Esthetician, Manicurist
- NC Real Estate Commission: Provisional Real Estate Broker
Additional Details
The number of first-time test-takers and the number passing were provided to the System Office by agencies issuing the license or certification. Depending on the exam, data may be provided on a fiscal or calendar year. Exams are listed above. Selection of exams based on:
- Requirement to pass in order to practice in North Carolina
- Strong association with an occupation (not part of a job)
- At least 50 test-takers statewide in 2017-18
- At least 5 colleges with test-takers in 2017-18
University Transfer Performance
| 18-19 | 19-20 | 20-21 | 21-22 | |
|---|---|---|---|---|
| NCC Transfer Performance | 0.955 | 1.022 | 0.975 | 0.958 |
| Baseline | 0.922 | 0.922 | 0.871 | 0.917 |
| Excellence Level | 1.024 | 1.024 | 1.036 | 1.031 |
Purpose: To ensure the academic success of community college students at a four-year university or college.
Description: Index score based on the percentage of community college students (Associate Degree completers and those who have completed 30 or more articulated transfer credits) transferring at a four-year university or college during the fall semester who remain enrolled at any four-year university or college the subsequent fall semester or graduate prior to.
Calculation:
Success Rate
Denominator: Students who earned an Associate Degree during the fall, spring, and/or summer of the academic year and/or accumulated at least 30 articulated transfer credits in the NCCCS prior to the end of the summer term of the cohort year, who enrolled the subsequent fall in any 4-year college or university that participates in the National Student Clearinghouse Student Tracker program.
Numerator: Of those in the denominator, the number who graduate with a bachelor’s degree or higher prior to the next subsequent fall semester or remained enrolled in any 4-year college or university during the subsequent fall semester.
Index Score
College success rate divided by the systemwide success rate.
Data Sources
- Comprehensive Curriculum Student Report
- Graduation Extract data file
- National Student Clearinghouse
Graduation Rates
Nash Community College evaluates the graduation rate of students using data from the National Student Clearinghouse (NSC). To monitor completion rates, the NSC uses a 6-year cohort to track the progress of first-time-in-college degree-seeking students. As a result, the data is slightly outdated from current results while awaiting the end of the 6-year cycle for each cohort of students. NCC utilizes NSC data due to its comprehensive completion data for institutions nationwide.
| Fall 2013 Cohort | Fall 2014 Cohort | Fall 2015 Cohort | Fall 2016 Cohort | Fall 2017 Cohort | |
|---|---|---|---|---|---|
| Nash Community College | 47.33 | 40.15 | 40.57 | 43.09 | 45.69 |
| National Benchmark | 40.76 | 40.28 | 42.17 | 43.08 | 43.45 |
| Black Men | Black Women | Hispanic Men | Hispanic Women | White Men | White Women | |
|---|---|---|---|---|---|---|
| Fall 2013 Cohort | 36.25 | 25.82 | 83.33 | 40.05 | 59.60 | 58.57 |
| Fall 2014 Cohort | 20.00 | 25.45 | 57.14 | 28.41 | 54.84 | 49.50 |
| Fall 2015 Cohort | 15.47 | 21.84 | 50.00 | 42.86 | 53.68 | 49.47 |
| Fall 2016 Cohort | 31.24 | 20.86 | 40.00 | 38.99 | 55.93 | 57.32 |
| Fall 2017 Cohort | 28.74 | 36.76 | 69.23 | 41.18 | 49.49 | 53.25 |
The data for this report were drawn from the Enrollment Reporting and DegreeVerifySM services of the National Student Clearinghouse®, which tracks 96 percent of college enrollments nationwide. Completions were identified using degree and certificate records submitted by institutions as part of their participation in DegreeVerify. For institutions that do not participate in DegreeVerify, completions were identified using enrollment records indicating the enrollment status of graduated.
The cohort examined in this study is made up of first-time degree-seeking students, of any age, who began their postsecondary studies in the Fall term of the cohort year. Showing intent to seek a degree or certificate is defined in the national report as follows:
- For students who started at four-year institution, enrolled at least one term with an intensity of halftime or higher, and
- For students who started at two-year institutions, either:
- Enrolled full time for at least one term within the first academic year or
- Enrolled at least half time for any two terms before December 31st of the second academic year.
The study followed the cohort through June 30th of the sixth academic year and highlights six-year student outcomes, including degree and certificate completion as well as continuing enrollment (persistence).
Strategic Planning
Other Documents
- Institutional Effectiveness
Contact

Marcus Lewis
Director of Institutional Research
Building: Building A
Room: 2217
Phone: 252-451-8287
Success Network - Supporting Your Power to Succeed
![]() The Quality Enhancement Plan (QEP) is an integral component of the reaffirmation of the accreditation process with the Southern Association of Colleges and Schools Commission on Colleges (SACSCOC). The five-year plan reflects a commitment to enhance institutional quality by focusing on an issue the institution considers important to student learning and/or success.
The Quality Enhancement Plan (QEP) is an integral component of the reaffirmation of the accreditation process with the Southern Association of Colleges and Schools Commission on Colleges (SACSCOC). The five-year plan reflects a commitment to enhance institutional quality by focusing on an issue the institution considers important to student learning and/or success.
Related Links
Why did the College select the Success Network as our QEP topic?
The QEP Topic Discovery Team, composed of a diverse cross-section of faculty, staff, and a student, was charged with identifying potential topics emerging from the institutional assessment processes and aligned with the College mission. Following this analysis, the team held a series of focus groups and online surveys to explore the needs originating from the institutional evaluation process. Emerging issues included that students struggle with navigating resources and technology and are burdened with various challenges including home life support, financial stability, mental health, time management, online readiness, and academic skills. Employees concurred that the College offers a tremendous amount of services, yet students do not access them as frequently as expected nor is there a system for follow-up if a student was referred to a resource. During the focus groups, employees expressed surprise because they, themselves, were not aware of all the resources NCC offered. The ability to provide proactive and consistent high touch intervention and follow through was identified as a need to improve students’ educational experience. After this comprehensive and collaborative process, NCC selected the establishment of a Success Network as the College’s QEP in order to connect students to the help they need when they need it.
What is the end game? What will the QEP/Success Network look like when fully implemented?
The Success Network represents the wealth of resources that are currently in place on the NCC campus. The vision of the QEP is to connect students with services and resources to support their success through the guidance and mentorship of a Success Coach from application to graduation. So, in the end, every student will be assigned a Success Coach to advise, mentor, guide, and support him or her through personal outreach and high-touch follow-through. Our current advising model will transition to a professionally staffed, success coaching, data informed case-management model.
What is a Success Coach? How are they different from a traditional academic advisor?
A Success Coach helps students navigate college by listening and seeking to understand the individual strengths and challenges of each student. In addition to traditional academic course planning, the Success Coach serves as a point of connection between various resources, provide proactive outreach and follow-up, responds to alerts, assists with professional and personal goal setting, provides academic success strategies, advocates on a student’s behalf, fosters student accountability, as well as identify and seek to address gaps in services.
When does the QEP start? What is happening in the pilot year?
The QEP is a five-year initiative culminating in an impact report submitted to SACSCOC after the fifth year. Our QEP doesn’t officially start until the 2021/22 academic year, but critical elements and key leadership are in place to demonstrate to the visiting team that NCC has the commitment to implement. Many colleges refer to this as the pilot year. The visiting team will expect the College to be both aware of and excited about the QEP. In our pilot year, caseloads will not be assigned. Instead, we will collect baseline data for assessment, establish protocols, workflows, training, and practice coaching techniques and procedures.
What are the student success and measurable outcomes for the QEP?
| Success Outcome | Measurable Outcome |
|---|---|
| Students who interact with a Success Coach will be connected to the appropriate service(s) and resource(s) within the Success Network. | 75% of students for whom a success plan is developed will begin within 14 days of initiation by the coach. |
| Students who interact with a Success Coach and connect with the appropriate service(s) and resource(s) within the Success Network will persist from semester to semester. | First-time student cohort who are assigned a Success Coach will persist from fall semester to subsequent fall semester at a 4% higher rate than baseline historical performance of first-time students (IPEDS cohort). (Note: Excludes students who completed a credential.) |
| Students who interact with a Success Coach and connect with the appropriate service(s) and resource(s) within the Success Network will progress successfully from point of entry to subsequent courses required in their program of study. | First-time student cohort who are assigned a Success Coach will have a passing rate that is 3% higher than baseline historical performance of first-time students (IPEDS cohort) |
| Students who interact with a Success Coach and connect with the appropriate service(s) and resource(s) within the Success Network will complete their program of study. | First-time student cohort who are assigned a Success Coach will graduate at a 3% higher rate than the baseline historical performance of first-time students (IPEDS cohort). {Note: Graduation rates will be compared at the 150% and 200% point.} |
How will the success outcomes be assessed?
Assessment and evaluation will be conducted continuously throughout the QEP project. Assessment will be coordinated by the QEP Director in collaboration with the Director of Advising Services and Institutional Effectiveness. Actual outcomes will be compared against benchmarks and attainment of target goal. Historical baseline data will be utilized to ensure that success outcomes were not impacted in some spurious way by the introduction of the Success Network.
Can the Success Network grow beyond the QEP?
The seed of inspiration for the Success Network was the result of the broad-based process to identify a need the College would address to support student success. The specific mechanism to deliver the success outcomes of the QEP are the Success Coaches. However, one of the reasons the QEP Topic Discovery Team selected the Success Network was its inherent ability to grow, to identify and address additional barriers that impede student success. Fundamentally, the Success Network is the connection of all the services, partners, and resources at NCC working collaboratively to meet student needs.
Contact

Renee Martinez
Executive Director of Advising Services
Building: Building A
Room: 2031
Phone: 252-451-8373
Message from the President
 Welcome to Nash Community College – an incredible institution of higher education that is committed to student success. NCC provides comprehensive programs designed to maximize student learning and achievement and position graduates for lifelong growth.
Nash Community College is a place where students from all walks of life come to expand their opportunities through academic, cultural, and social experiences. As a first-choice college, we take pride in supporting students both inside and outside of the classroom.
Our students experience a welcoming team of faculty and staff engaged in professional learning opportunities and working in tandem with community partners to offer relevant training for real-world careers. We work hard to maintain modern facilities, state-of-the-art technology, and equipment, and apply operational best practices in all areas of campus.
NCC alumni are involved in award-winning scholarship, international research, and rewarding careers making a difference in the greater community every day.
Whether your goal is to prepare for university transfer or enter the workforce, we are glad you’re here. You are making the right decision to select a college environment known for being student ready.
I am truly fortunate to be able to lead NCC into the future following four previous presidents who have shaped the campus into an incredible community college.
Regards,
Lew K. Hunnicutt, Ph.D.
Board of Trustees

James A. Mercer
Chair, Nashville
Angela Watkins Gailliard
Rocky Mount

Russell L. Proctor III
Vice Chair, Rocky Mount

Paul S. Jaber
Rocky Mount
Natalie Brooks
Nashville

William M. Marshburn
Rocky Mount

Samuel Dickens, III
Rocky Mount

Amy Pearson
Bailey

Katherine Wiggins Fisher
Rocky Mount

J. Wayne Outlaw
Rocky Mount

C.E. (Sonny) Foster
Rocky Mount

Damian L. Tucker
Dortches
Senior Leadership Team


Kochi Angar
Department Chair, Mathematics & Natural Sciences/Professor, Mathematics
Building: Science & Technology
Room: 7247
Phone: 252-451-8396

Ranathunga Ariyarathna, Ph.D.
Instructor, Chemistry
Building: Science & Technology Building
Room: 7239
Phone: 252-451-8295

KJ Askew
Director, Marketing & Strategic Engagement
Building: Building A
Room: 2223
Phone: 252-451-8235

Susan Barkalow
Human Resources Director
Building: Business & Industry Center
Room: 1113
Phone: 252-451-8258
Sharon Barnhill
Single Stop Coordinator / Student Wellness Assistant
Building: Building B
Room: 2111
Phone: 252-428-7334

Paula Bateman
Registration Specialist, Continuing Education
Building: Continuing Education
Room: 8232
Phone: 252-451-8216
Chelsie Batten, Ph.D.
Instructor, Math
Building: Science & Technology
Room: 7236
Phone: 252-451-8398
Franchesca Battle
Department Chair, Digital Teaching & Learning, English/Humanities/Professor
Building: Building B
Room: 2107
Phone: 252-451-8247

To submit an upcoming event, please email nccpr@nashcc.edu
August 2025 |
||||||
|---|---|---|---|---|---|---|
| Sun | Mon | Tue | Wed | Thu | Fri | Sat |
|
2
|
||||||
|
3
|
4
• • • |
6
• • |
7
• • • • |
9
|
||
|
10
|
11
• • |
12
• • |
13
• • • • |
14
• • • |
15
• • |
16
|
|
17
|
18
• • • • |
19
|
20
• |
21
• |
22
|
23
|
|
24
|
25
• |
26
|
27
• |
28
• |
29
|
30
|
|
31
|
||||||
Approximately 12,000 citizens participate in programs at Nash Community College annually.
Nash Community College is located at 522 North Old Carriage Road in Rocky Mount, North Carolina. The college was founded in 1967 and is a public two-year post-secondary educational institution with an open-door admissions policy.
The College is located on 125 acres midway between Nashville and Rocky Mount, less than a mile off U.S. Highway 64 Bypass and U.S. Interstate 95 in Nash County.
DEGREE PROGRAMS
10
DIPLOMA PROGRAMS
0
CERTIFICATE PROGRAMS
20
COURSES
999
Operations Spending Impact
$
0
Million
Student Spending Impact
$
0
Million
Alumni Impact
$
0
Million
Annual Economic Impact
= $
0
Million
Significant Dates
The Community College Act is passed by the North Carolina Legislature, providing an avenue for local governing bodies to establish an institution in their own communities.
1957
The first Board of Trustees of the “Nash County Technical Institute Unit” is appointed.
1967
Jack D. Ballard is hired as the first president of the institution.
1967
Nash Technical Institute is established on September 7, 1967.
1967
The new campus is formally dedicated.
1975
The college community is saddened by the untimely death of its first President, Jack Ballard.
1979
The second president of Nash Technical Institute is selected: Dr. J. Reid Parrott, Jr.
1980
The name is changed from Nash Technical Institute to Nash Technical College.
1982
The Nash Technical College Foundation is incorporated.
1983
The General Assembly gives authority to Nash Technical College to convert to a community college, enabling the college to offer the university transfer program and to change the name to Nash Community College.
1987
Nash Community College participates in the statewide effort of reengineering all of its curriculum programs.
1997
Nash Community College changes from a quarter system to a semester system. An evaluation of all curriculum programs and services was conducted to meet workforce training needs and to ease transfer of programs and courses within the community college system as well as to the four-year institutions.
1998
The Betsy B. Currin Child Development Center opens, providing on-campus childcare and a model instructional laboratory for students enrolled in the early childhood and teacher associate programs.
1999
The Business & Industry Center is completed and includes the Allen H. and Winnie E. Brown Auditorium, the Continuing Education Department, the Campus Store, and administrative offices.
1999
Dr. J. Reid Parrott, Jr. retires as President of Nash Community College and is granted the title of President Emeritus.
1999
Dr. Katherine M. Johnson is selected as the third President of Nash Community College.
2000
The Julian B. Fenner Memorial Clock is given to the College as the first historical marker from Skipper Fenner Parker in memory of her late husband, Julian Fenner, who served as the first Chairman of the Board of Trustees.
2000
North Carolina voters approve a $3.1 billion dollar Higher Education Bond Referendum providing funds for on-campus repairs, renovations and eventual construction of a science and technology building.
2000
The College receives a grant from the DeLeon Carter Foundation to construct the Myrtle Carter Henry Amphitheater.
2001
Reaffirmation of accreditation received by the Southern Association of Colleges and Schools Commission on Colleges (SACSCOC).
2002
The Myrtle Carter Henry Amphitheater is dedicated on June 3, 2003.
2003
Nash Community College receives $1 million Economic Development Administration grant.
2004
Ground-breaking ceremony for Science and Technology Center.
2004
Nash County native Dr. Marvin R. Joyner selected as interim president.
2005
William S. Carver II is selected as the fourth President of Nash Community College.
2005
The Science and Technology Center is dedicated on October 26, 2005.
2005
Nash Community College’s Betsy B. Currin Child Development Center (CDC) receives accreditation from the National Association for the Education of Young Children (NAEYC).
2007
Nash Community College Foundation celebrates its 25th anniversary.
2008
Nash Community College purchases an additional 25 acres.
2010
Nash Community College celebrates reaffirmation of accreditation by the Southern Association of Colleges and Schools Commission on Colleges (SACSCOC)
2011
Bond referendum is approved for Continuing Education and Public Services Building.
2012
Nash Community College celebrates 45 years of teaching and learning.
2012
Business and Industry Center expands to include Culinary Arts and Hospitality Management classrooms.
2012
Betsy B. Currin Child Development Center expands to include Early Childhood Education classrooms.
2012
Road constructed to connect south campus to Eastern Avenue.
2013
$1.5 million Economic Development Administration grant received for Continuing Education & Public Services Building.
2013
Ground-breaking ceremony for Continuing Education & Public Services Building.
2013
Continuing Education & Public Services Building dedicated on June 16.
2015
Bond referendum is approved to support Advanced Manufacturing and Veterinary Technology expansion.
2016
Ground-breaking ceremony for the Advanced Manufacturing and Cosmetology Buildings.
2017
Ribbon cutting and dedication ceremony for the Advanced Manufacturing and Cosmetology Buildings.
2018
Ribbon cutting ceremony for Nash-Rocky Mount Early College High School expansion into Building C.
2019
William S. Carver II retires as President of Nash Community College and is awarded the Order of the Long Leaf Pine.
2019
Dr. Lew Hunnicutt is selected as the fifth President of Nash Community College.
2019
Nash Community College acquires an additional 13 acres.
2022
Ground-breaking ceremony and naming ceremony for the Braswell Veterinary Medical Technology Building.
2023
Ground-breaking ceremony for the Driver Training Center.
2024
Ribbon cutting and dedication ceremony for the Braswell Veterinary Medical Technology Building.
2024
